
Connection Project Reporting
The AESO publishes information for all projects following the AESO Connection Process on a monthly basis. This includes information about in-progress projects with an accepted System Access Service Request (SASR), recently energized projects, and recently cancelled projects. Below you will find monthly project data reported in an Excel Project List, a GIS map and an interactive Power BI dashboard. The AESO has also published a new Connection Project Trends Dashboard showing how supply and load in the AESO Connection Process have changed quarterly over time.
Connection Project List Dashboard
The Connection Project Dashboards are interactive Power BI tools that display the most recent data and historical trends from the Connection Project List. Users can click on elements within the dashboards to filter information and explore the data in greater depth to gain valuable insights.
We welcome your input and feedback on these new interactive tools. Please share your comments by sending an email to customer.connections@aeso.ca.
The latest project list and a guide explaining the information provided in the list can be found here:
-
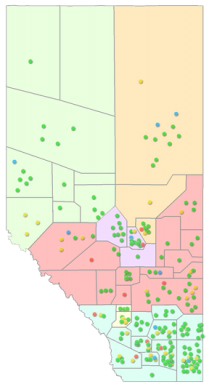
Click the project map on the right to open the interactive mapping tool. A guide for using the map and a downloadable GIS shapefiles and Google Earth KMLs showing project locations and existing transmission system layers can be found below:
- Connection Project Map User Guide
- Project List GIS Shapefile
- Project List KML
- Transmission System GIS Shapefile
- Transmission System KML
For any questions or comments on the Connection Project List and map, please email customer.connections@aeso.ca
Project list and Map updated 2026-11-03
-
-
Connection Project List Archives
2026
- January 2026
- February 2026
- March 2026
- April 2026
- May 2026
- June 2026
- July 2026
- August 2026
- September 2026
- October 2026
2025
- December 2025
- November 2025
- October 2025
- September 2025
- August 2025
- July 2025
- June 2025
- May 2025
- April 2025
- March 2025
- February 2025
- January 2025
2024
- November 2024
- October 2024
- September 2024
- August 2024
- July 2024
- June 2024
- May 2024
- April 2024
- March 2024
- February 2024
- January 2024
2023
